AI Product Design
Talent Marketplace
Go-To-Market StrategyE
UX Strategy & Research
Cross-Functional Collaboration
Startup Product Development
CUSTOMER EXPERIENCE

Context & Overview
Project Overview
Fannie Mae sought a digital solution that could illustrate the complete mortgage loan lifecycle from application through loan retirement. The goal was to provide employees across divisions—including App to Closing, Servicing, Shared Services, and Capital Markets—with visibility into business processes, customer touchpoints, and dependencies between teams.
My Role & Scop
Lead Designer responsible for end-to-end design, research, and prototyping.
Collaborated with a UX designer and front-end developer over a 10-week period.
Engaged cross-functionally with stakeholders in enterprise architecture, marketing, legal, and business operations to align requirements and validate design decisions.
Delivered desktop interactive interface and guided iterative usability testing with employees.
Scale & Impact
Tool is now available to ~2,500 Fannie Mae employees across divisions.
Supports onboarding for ~300 new employees annually.
Influences enterprise planning by providing clear visibility into processes impacting $4T+ in active mortgage loans in 2019.
Challenge & Problem Statement
Siloed team structures were creating knowledge gaps across Fannie Mae’s business. Employees could not easily understand the interdependencies between divisions or see how their work impacted customer outcomes. Existing documentation was fragmented, leading to duplication of effort and reduced collaboration.
Primary Challenges
No single source of truth for loan lifecycle processes.
Employees struggled to navigate workflows across divisions.
Limited visibility into how customer touchpoints intersected with internal operations.
Difficulty onboarding new employees to understand the enterprise’s mortgage operations.


"
The hardest part wasn’t visualizing the lifecycle — it was connecting people who’d never seen how their work fit into the bigger picture. Once we mapped the story together, the silos started to disappear.
Discovery & Research
We conducted a 10-week discovery and research phase to align stakeholders, capture employee pain points, and validate design requirements.
Research Activities
Stakeholder mapping across 6 divisions.
15 employee interviews spanning App to Closing, Servicing, and Capital Markets teams.
Competitive research into internal knowledge management and lifecycle mapping tools.
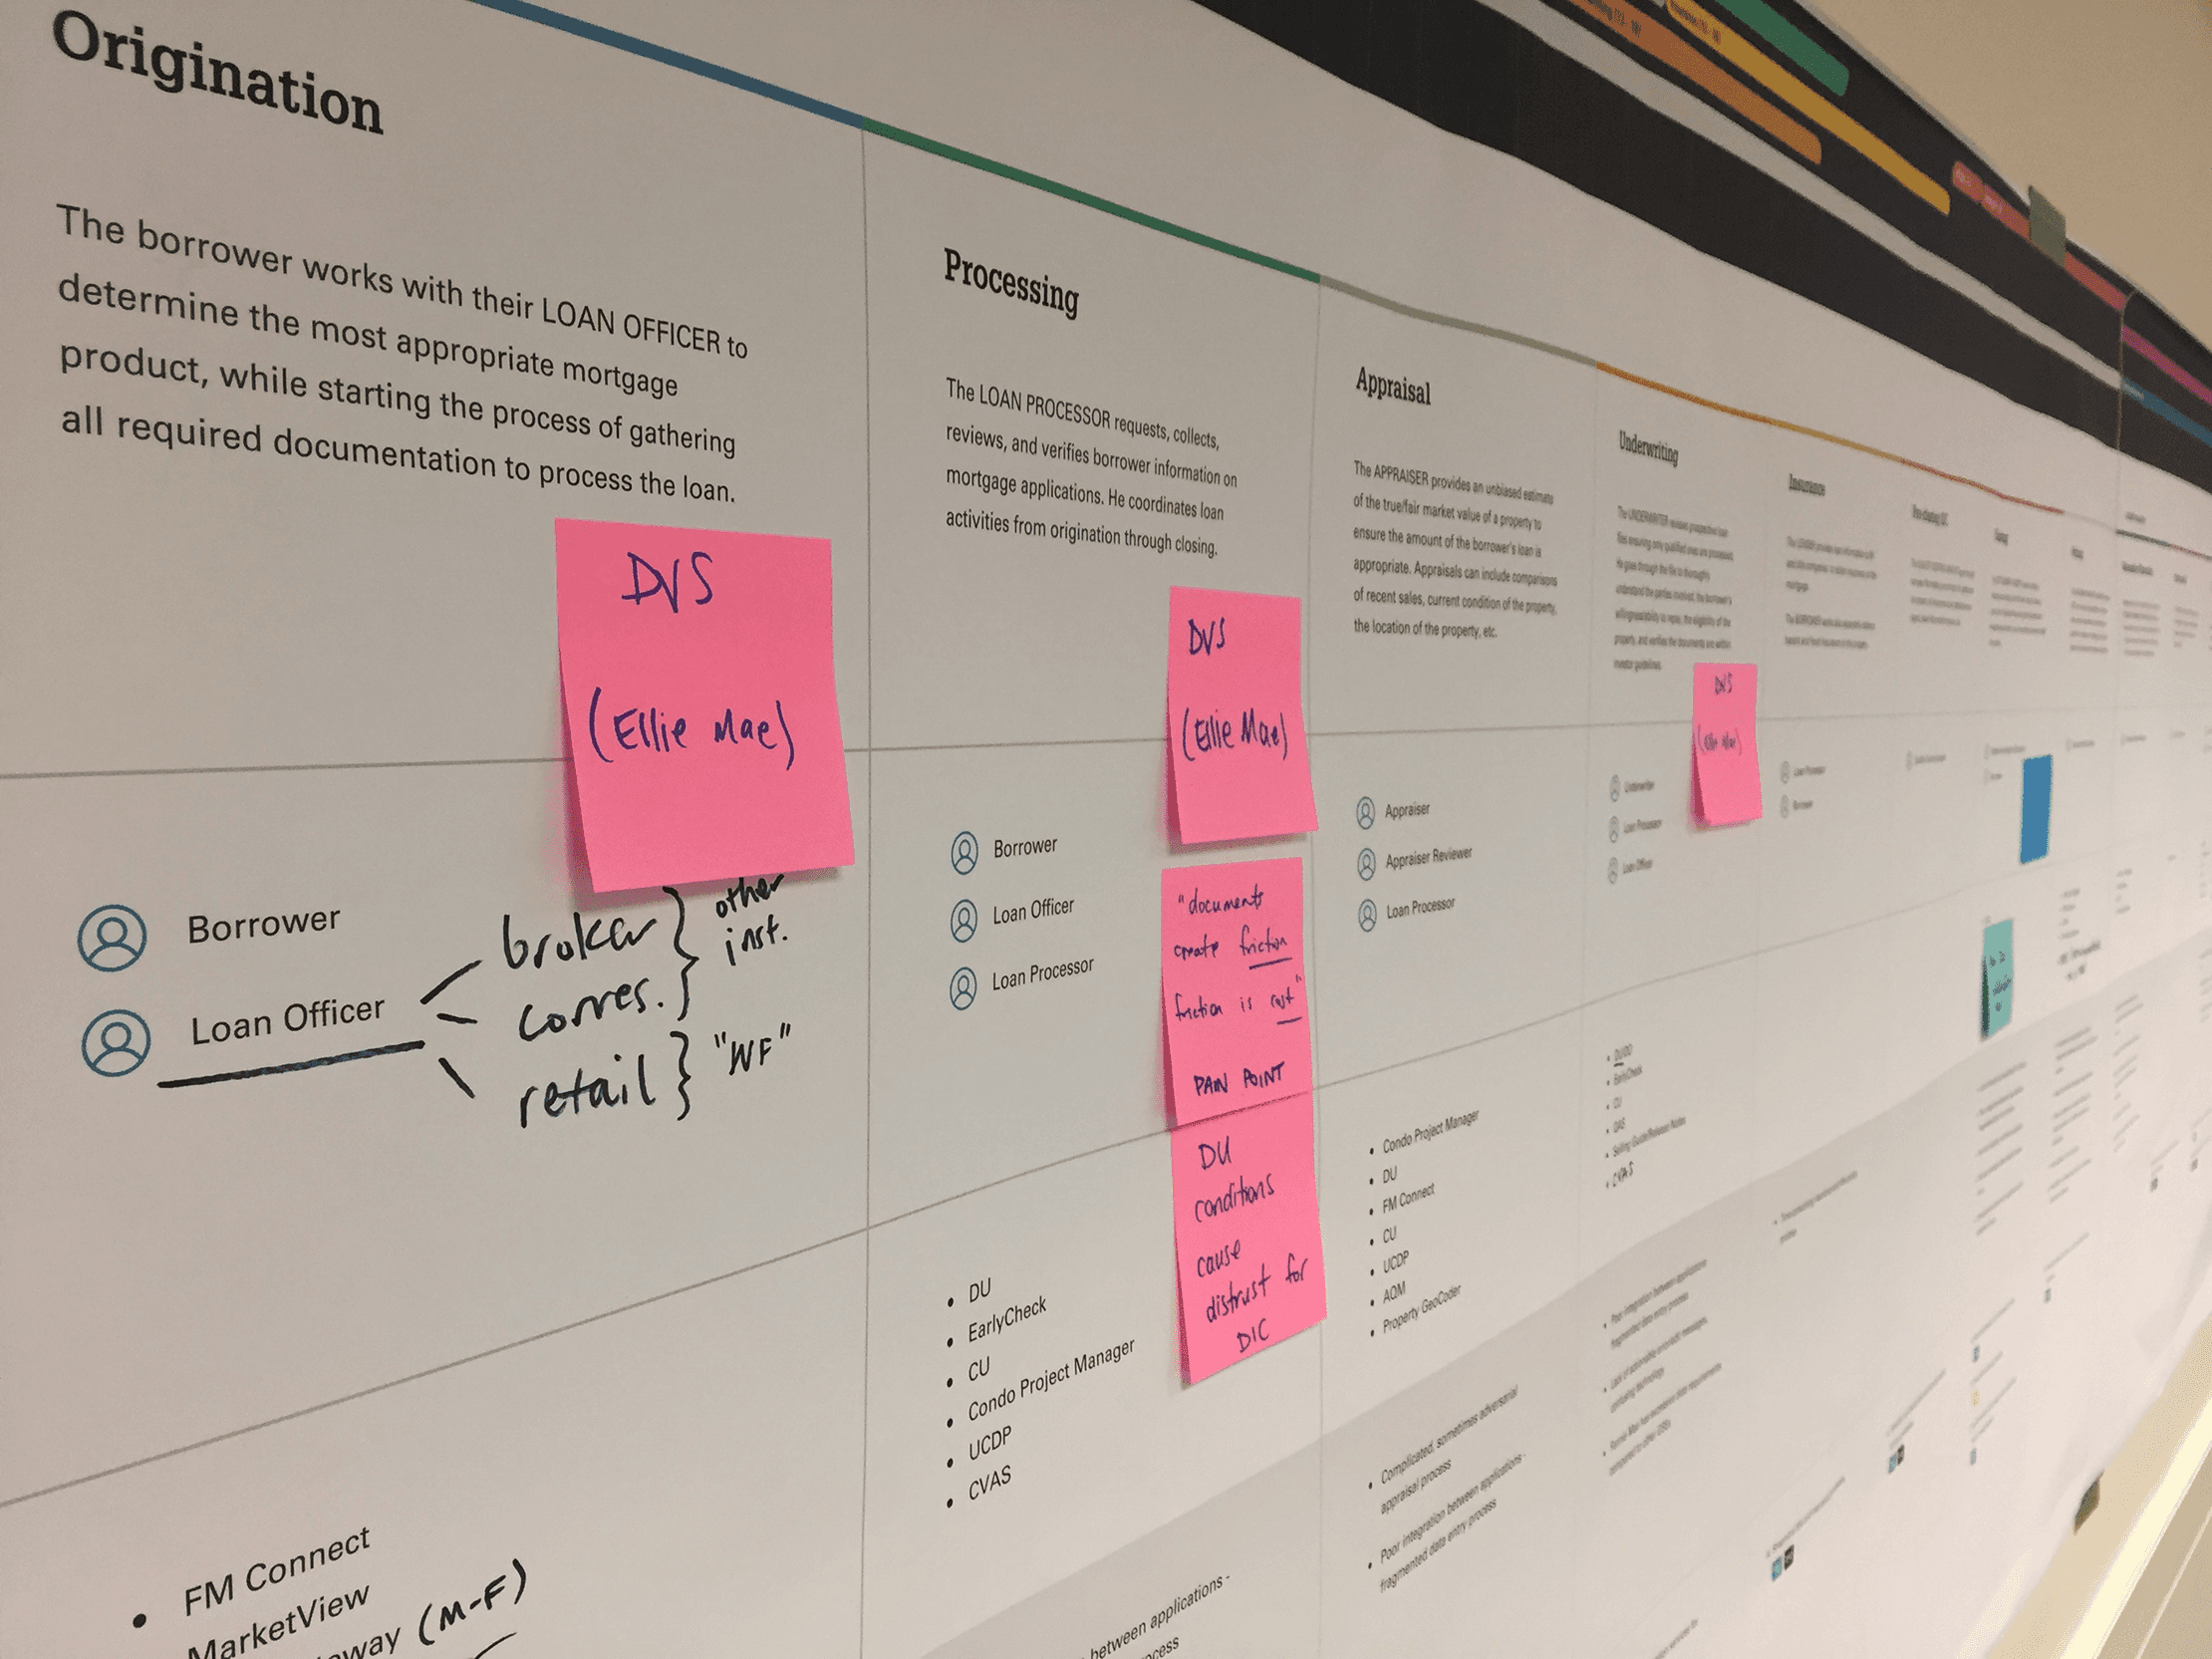
Four customer journey mapping workshops to capture the end-to-end mortgage process.
Affinity mapping and synthesis of pain points (~112 pain points captured).
Findings
Employees needed real-time visibility into workflow dependencies to reduce duplicated effort.
Knowledge gaps slowed onboarding, with new hires taking up to 4 weeks to understand cross-divisional processes.
High-value insight: employees were less interested in data visualizations and more in structured, navigable process mapping.

"
We realized the value wasn’t just in documenting the process — it was in making the invisible visible. When employees saw how their decisions shaped the customer journey, collaboration became instinctive.
Design Strategy & Approach
Vision
Create an interactive, web-based tool that visualizes the end-to-end mortgage lifecycle, linking business processes with customer touchpoints, and providing clear navigation for cross-functional understanding.
Design Principles
Clarity: Every step of the lifecycle should be understandable in context.
Navigation: Easy movement across stages and divisions.
Scalability: Tool should accommodate evolving business processes.
Usability: Desktop-first interactive interface optimized for employees performing daily workflow tasks.
Approach
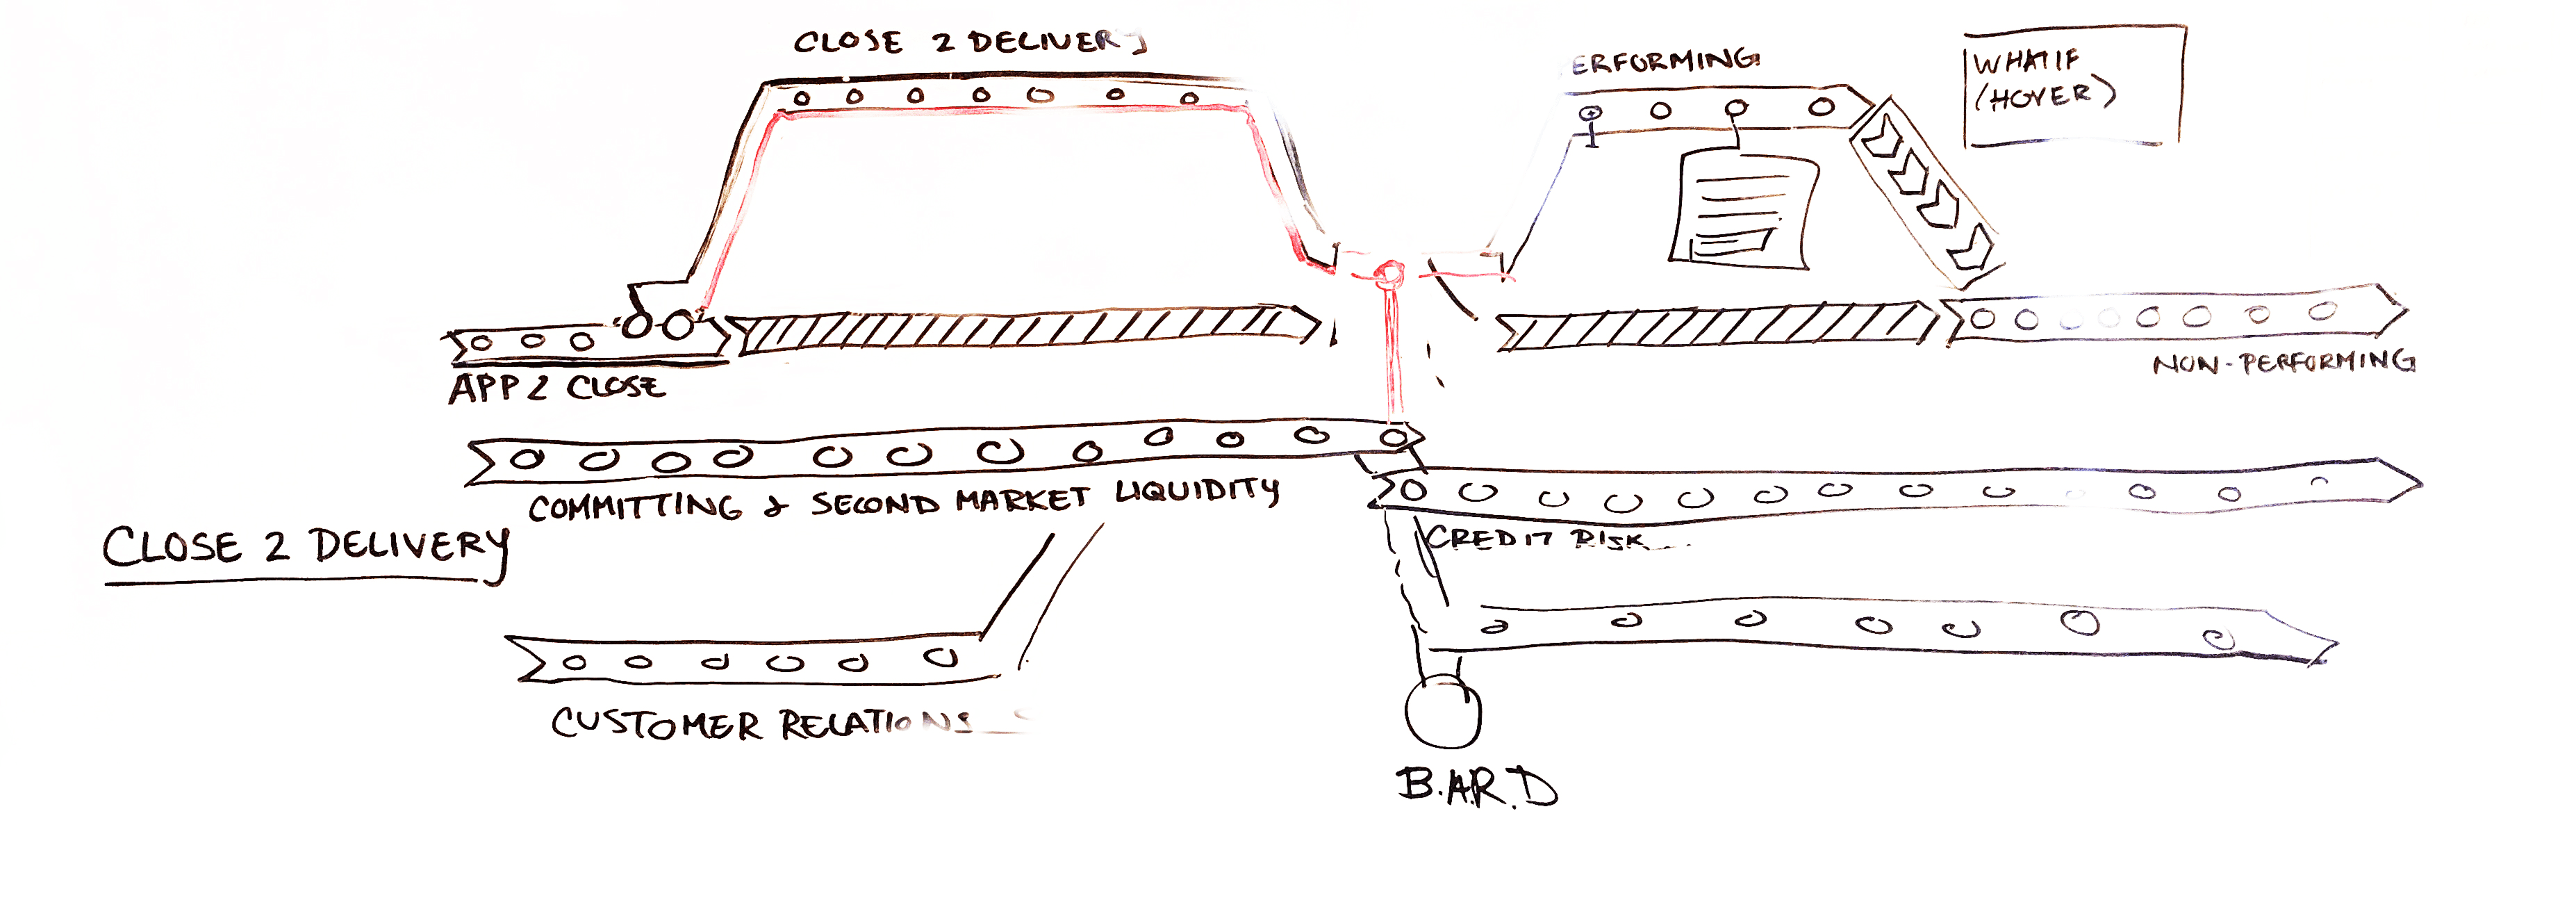
Diverged through low-fidelity sketches and wireframes, mapping value stages and underlying business processes.
Converged on medium-fidelity interactive prototype for usability testing.
Iteratively refined prototype based on feedback from 7 usability test participants.
Developed high-fidelity mockups and UI components with alignment to Fannie Mae’s design system.


Execution & Collaboration
Conducted weekly stakeholder touch-points to review progress and solicit feedback.
Partnered with technology teams to ensure feasibility and alignment with backend data sources.
Used iterative usability testing to validate information architecture and interaction design.
Managed cross-division coordination remotely between DC and Dallas teams, supplemented with in-person workshops.
Process Highlights
Broke the lifecycle into segments (Application → Closing → Servicing → Shared Services → Capital Markets) to reduce complexity.
Created interactive elements to illustrate how processes across divisions impacted customer outcomes.
Integrated feedback loops for continuous improvement and adoption.

Outcome & Impact
Adoption & Usage
Tool deployed to 2,500 employees across divisions.
New hire onboarding time reduced from 4 weeks to 2 weeks.
Employee satisfaction with lifecycle visibility: 91% positive feedback in post-launch survey.
Usability Metrics
Total task attempts in usability testing: 24
Successful completions: 20
Partially successful: 3 (0.5 points each)
Success rate: 89.5%
Strategic Impact
Enhanced cross-divisional understanding and reduced knowledge silos.
Leadership now uses the map to inform strategic decisions and prioritize digital transformation initiatives.
Continuous in-app feedback allows real-time iteration to reflect evolving business processes.
Employee Quote from Post-Launch Survey
“Finally, I can see how my work connects to the bigger picture — it’s a game-changer for collaboration.”